


UK Beats the US? Comparing Returns of Scottish Mortgage (SMT) and S&P 500 Over 10 and 15 Years
How long-term UK investing delivered bigger gains than Wall Street’s favourite index.

Many UK investors are increasingly shifting their money to the US market, chasing what they believe are better returns. The narrative goes like this: Wall Street’s tech giants are unstoppable, and the S&P 500 is the best place to grow your wealth. But is that really true? Is the US market consistently outperforming, or are UK investors overlooking opportunities closer to home?
As a promoter—and firm believer—in the potential of LSE-listed companies, I decided to dig deeper and run my own analysis. What I found may surprise you.
In this article, we compare the Scottish Mortgage Investment Trust (SMT)—a UK-listed global growth powerhouse—with the S&P 500, over 10 and 15 years. The results challenge common perceptions and could make you rethink where to invest for long-term returns.
Overview:
Both the S&P 500 (a broad U.S. equity index) and the Scottish Mortgage Investment Trust (SMT, a UK-listed global equity fund) have delivered strong returns over the past decade and half. Here we compare their total returns (including reinvested dividends) over approximately 10-year (2014–2024) and 15-year (2009–2024) periods, and illustrate how much a $1 investment grew in each case.
10-Year Performance (2014–2024)
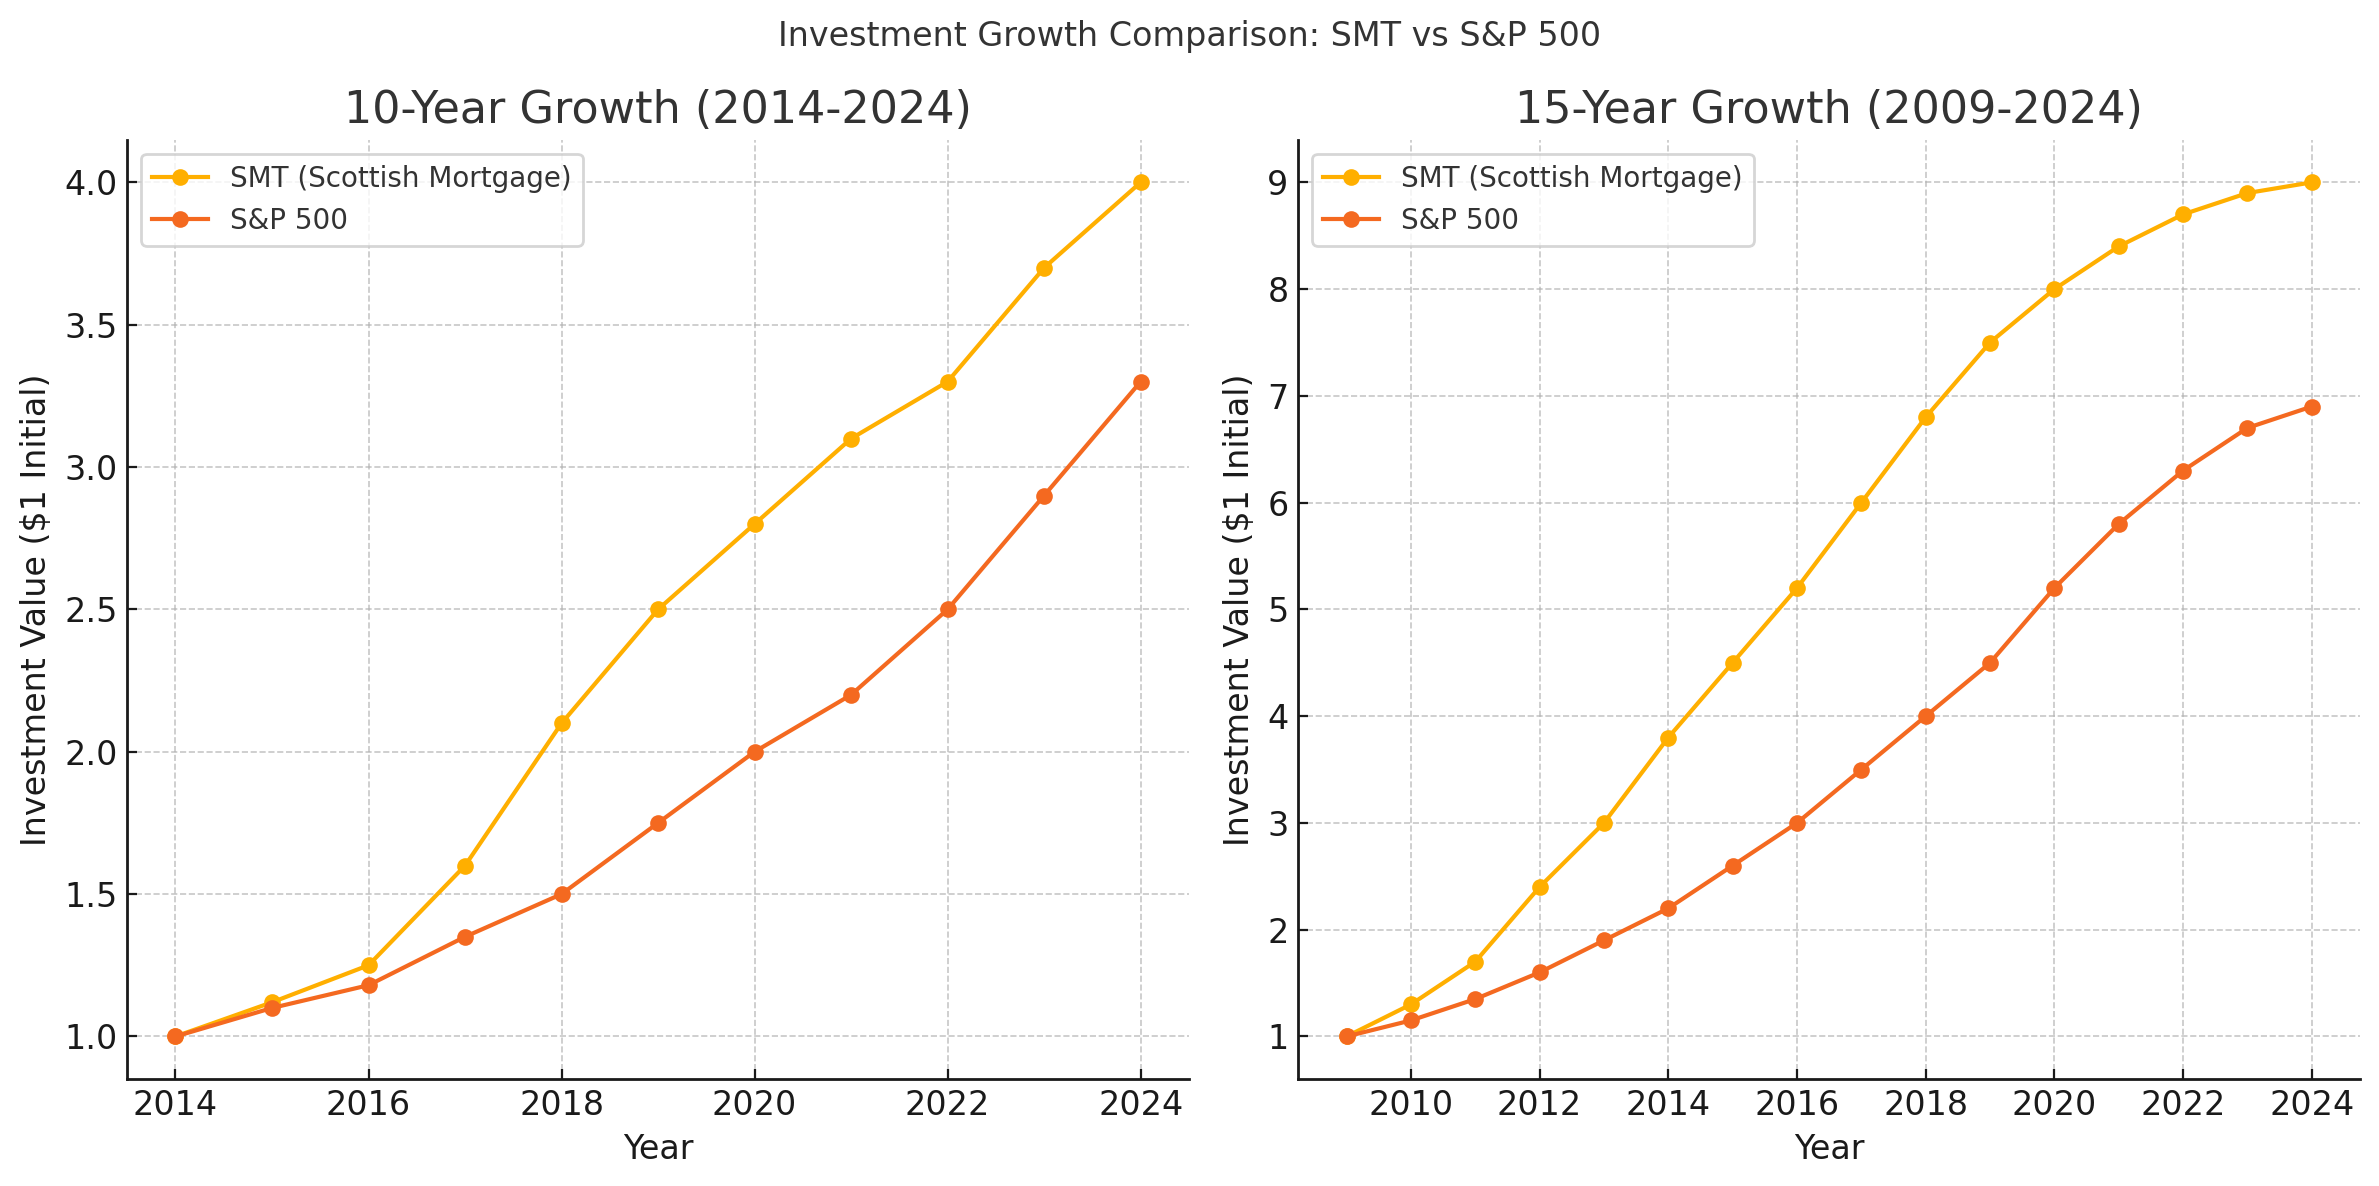
Over the last ten years, SMT outpaced the S&P 500 in total return. SMT’s net asset value (NAV) grew roughly +300% (approximately quadrupling) whereas the S&P 500’s total return was about +230% (a little more than tripling). In other words, $1 invested 10 years ago would now be worth about $4.00 in SMT versus roughly $3.30 in the S&P 500. This period (2014–2024) was marked by a massive equity bull run. The S&P’s gains were driven by booming U.S. tech giants like Apple, Microsoft, Amazon, and Alphabet. SMT, managed by Baillie Gifford, benefited even more by holding many of these global growth stocks (Tesla, Amazon, ASML, etc.) and even private companies like SpaceX and ByteDance. However, SMT’s higher return came with higher volatility – for instance, it surged during the late 2010s and fell sharply in 2022 amid a tech downturn.

Figure: Growth of $1 over 10 and 15 Years – A $1 investment in SMT (orange) versus the S&P 500 (yellow) and its value at the end of 10-year and 15-year periods (total return, with dividends reinvested). SMT outperformed in both horizons, turning $1 into about $4.00 over 10 years and $9.00 over 15 years, compared to $3.30 and $6.90 for the S&P 500.
15-Year Performance (2009–2024)
Over a 15-year span, which includes the post-2008 financial crisis recovery, both markets saw extraordinary growth, but SMT still leads. SMT delivered roughly +800% total return (about a 9-fold increase), whereas the S&P 500 returned around +590% (about a 7-fold increase) over this period. In practical terms, $1 invested in early 2009 would be worth roughly $9.00 in SMT today, versus about $6.90 if invested in the S&P 500. These figures underscore the remarkable bull market since 2009 – for context, the S&P 500’s ~15% annual return over this period compounded to nearly a +842% gain by 2025 (almost 9.4× on your money). SMT managed to slightly outpace the S&P thanks to its concentrated bets on transformative growth companies during the 2010s. It rode the wave of disruptive tech (early investments in the likes of Tesla, Amazon, Alibaba, Nvidia, etc.) and also gained from privately held innovators that weren’t in public indices. The low-interest-rate environment after 2008 further boosted such growth stocks. By staying invested in high-conviction winners, SMT achieved explosive growth. However, it’s worth noting that SMT’s journey was volatile – after peaking in late 2021, it saw a sharp drawdown in 2022 as rising rates hit growth valuations, whereas the S&P 500’s broader diversification provided a bit more stability during that pullback
.
Key Takeaway:
Over both 10 and 15 years, SMT outperformed the S&P 500 in total returns. A long-term investor in SMT would have seen higher wealth accumulation than one in an S&P 500 index fund. However, SMT’s higher returns came with higher volatility and risk, given its concentrated growth-focused portfolio, whereas the S&P 500’s returns were steadier and backed by a more diversified basket of 500 large companies.
Macroeconomic Factors Influencing Returns
Several macroeconomic factors over the last 10–15 years have influenced the performance of U.S. and UK equities (and funds like SMT), including inflation, interest rates, monetary policy, and currency movements. Below we analyse these factors:
Inflation Trends and Impact
Inflation has a direct effect on real investment returns and often influences central bank policy (which in turn affects equities). From 2010 through 2020, inflation was relatively subdued in both the U.S. and UK – generally in the ~1–3% range – which allowed stock returns to truly shine in real terms. This low inflation environment enabled central banks to keep monetary policy very accommodative, fuelling equity valuations. However, in the post-pandemic period (2021–2023), inflation spiked sharply. The U.S. saw inflation surge to ~9% at its 2022 peak (highest since early 1980s), and the UK experienced an even sharper rise – over 10% inflation, a 40-year high. In fact, UK inflation topped 11.1% in October 2022, the highest among G7 countries. Such high inflation erodes consumers’ purchasing power and can pressure corporate profit margins, creating headwinds for stock markets. High inflation also prompted aggressive interest rate hikes (discussed next) which hit equity valuations, especially for high-growth stocks. Notably, SMT’s tech-heavy portfolio suffered in 2022 when inflation fears and rate hikes caused investors to rethink lofty stock valuations. On the other hand, some UK equity sectors (e.g. consumer staples, utilities, energy) have historically been considered “inflation hedges” (due to pricing power or commodity linkage) and tend to hold up better during inflationary spikes, potentially cushioning UK indexes.
Interest Rates (US vs. UK) and Monetary Policy
Interest rate regimes in the U.S. and UK have been broadly similar over the past 15 years – both saw unprecedented low rates in the 2010s, followed by a rapid tightening cycle in the early 2020s – but there were some differences in timing and magnitude. In the aftermath of the 2008–2009 crisis, the U.S. Federal Reserve and the Bank of England (BoE) slashed rates to near-zero and launched quantitative easing, aiming to stimulate growth. This ultra-low rate environment persisted for much of the 2010s (the Fed’s rate mostly 0–0.25% until 2015, and BoE’s Bank Rate ~0.5% until 2016), creating a tailwind for equities. Cheap borrowing costs and abundant liquidity drove up stock valuations – benefiting indices like the S&P 500 and especially growth-oriented funds like SMT. The U.S. Fed’s policies (huge quantitative easing and prolonged low rates) have been credited with supporting U.S. equity valuations by making risk-assets attractive. The S&P 500’s tech sector in particular thrived on cheap capital fueling innovation and expansion.
The UK similarly had low rates, but there were some divergence points. The BoE briefly raised rates above 0.5% in 2017–2018 and again was the first major central bank to hike in the latest cycle (lifting off from 0.1% in Dec 2021). The Fed followed by March 2022. By 2023, the Fed had raised U.S. short-term rates to ~5%+, while the BoE’s rate reached ~4–4.5%. Rising interest rates put pressure on equities – they increase borrowing costs for companies and reduce the present value of future earnings, which particularly hurts high-growth stock valuations. This was evident in 2022–2023: high-duration growth stocks (like many in SMT’s portfolio) fell hard as rates jumped. More value-oriented sectors (banks, energy, etc., which are a larger share of the UK market) can actually benefit or hold up relatively better when rates rise. For example, bank profit margins often improve with higher rates, and indeed UK bank stocks have been more resilient recently.
Monetary policy differences: While both central banks tightened policy to combat inflation, the Fed’s moves were notably aggressive and the U.S. economy proved relatively robust, allowing larger hikes. The BoE faced the challenge of high inflation coupled with weaker growth (a stagflation risk), partly due to the UK’s energy import costs and Brexit effects. This meant UK policy had to balance taming inflation without hurting the economy. Both markets felt the withdrawal of stimulus: the era of easy money ending contributed to the stalling or reversal of equity gains in 2022. Overall, the long period of near-zero rates (2009–2021) was a major factor enabling the stellar 15-year equity returns we observed, and the subsequent rate rises have been a test of which markets can better withstand tighter conditions.
Currency Effects (GBP/USD) on Returns
Currency fluctuations between the U.S. dollar (USD) and British pound (GBP) have also influenced comparative returns. SMT is listed in the UK and reports in GBP, while the S&P 500 is a USD-based index – so when we compare “$1 invested” in each, we implicitly assume converting currencies as needed. Over the last 10–15 years, the USD has generally strengthened against the GBP. For example, GBP/USD was about 1.60–1.70 in 2008, but today is closer to ~1.25. A stronger dollar means a U.S. investment’s value increases when translated into pounds, whereas a UK investment’s USD returns would be lower once converted. Indeed, the strong dollar boosted USD-denominated returns for international investors holding U.S. stocks. Conversely, a U.S. investor in the UK market during this period would have seen some of their local-currency gains eaten away by a weakening pound. In our $1 comparisons above, we treated both in USD terms for simplicity – if we had measured SMT purely in GBP, its 10-year return was ~+330% in GBP (NAV basis), but in USD terms this would be a bit lower after accounting for the pound’s decline.
Currency moves also affect company earnings: a strong USD can hurt S&P 500 companies that export (making their goods pricier overseas), while a weak GBP can actually boost FTSE 100 companies’ earnings (many earn revenue in USD or euros). The Brexit referendum in 2016 was a clear example – the pound dropped sharply, which lifted the GBP-value of FTSE companies’ foreign earnings, contributing to a short-term jump in the FTSE 100. On the flip side, global investors became wary of UK assets due to Brexit uncertainty, contributing to a valuation discount on UK stocks (and a weaker currency).
In summary, the USD/GBP swing has generally favored U.S. investments in the past decade. A UK-based investor in the S&P 500 not only gained the index’s strong performance but also gained from the dollar’s strength (unless they hedged currency). Meanwhile, a U.S. investor in SMT or UK stocks would need to consider the currency drag – though going forward, if the pound is undervalued, it could potentially add upside if it strengthens. Managing currency risk (through hedged funds or diversification) is thus an important consideration when investing across these markets.
UK Market’s Edge in Long-Term Investing vs. the US
Despite the U.S. market’s outperformance in recent years, the UK market offers some potential advantages for long-term investors. Below are key areas where the UK market can have an edge over the US:
Valuations – Lower P/E and CAPE Ratios: UK equities generally trade at more attractive valuations than U.S. equities. The FTSE 100’s forward price-to-earnings (P/E) is around 10–12, significantly lower than the ~20+ of the S&P 500. Likewise, the cyclically-adjusted P/E (CAPE) for the UK is about 18–19, versus over 30 for the U.S. in late 2024. These lower valuations imply cheaper stocks and potentially higher future returns (since less growth is priced in). In other words, investors are paying less for each pound of earnings in the UK than for a dollar of earnings in the US. This valuation discount partly reflects recent headwinds (Brexit, slower growth), but it also means the UK market might have more upside if conditions improve or even if it merely maintains steady earnings. Historically, investing when valuations are lower has been associated with stronger long-term returns. The UK’s cheaper pricing provides a margin of safety and could deliver mean-reversion gains if global capital rotates back into undervalued regions.
Higher Dividend Yields (Income Advantage): The UK stock market offers a substantially higher dividend yield on average, which is a boon for income-focused investors and can enhance total returns over time. The FTSE 100’s dividend yield is currently around 3.5%–4%, whereas the S&P 500 yields only about 1%–1.5%. This means UK investors are getting more cash return yearly, which can be reinvested to compound wealth. High dividends can also provide a cushion in down markets – even if stock prices languish, investors still receive a stream of income. Over long periods, reinvested dividends are a major contributor to total return, so the UK’s yield advantage can compound significantly. For example, an investor might favor UK equities for a retirement portfolio where steady cash-flow and reinvestment is key. The U.S. market’s lower yield (many growth companies pay little or no dividend) means investors rely more on price appreciation. The UK’s culture of generous dividends (many FTSE firms have decades-long dividend track records) provides a more immediate tangible return on investment.
Sectoral Strengths – Different Industry Mix: The UK market has a very different sector composition than the U.S., which can be an advantage in certain economic cycles. The FTSE 100 is dominated by “old economy” sectors like Energy, Materials/Mining, Financials, and Consumer Staples. These sectors include world-class companies (e.g. Shell and BP in energy, HSBC in finance, Unilever in consumer goods, Rio Tinto in mining) that often have strong cash flows, tangible assets, and global reach. Such industries can thrive when commodities boom or when value stocks come back in favour. They also tend to be more defensive during downturns – e.g. people still need oil, banking services, and household products in any economy. In contrast, the S&P 500 is heavily weighted toward Technology and high-growth sectors (tech is ~25–30% of the S&P, vs <5% of the FTSE). This fuelled U.S. outperformance during the tech-driven rally, but also means the U.S. index is more exposed to the fortunes of a few mega-cap tech firms. The UK’s strengths in energy and commodities make it a good play for periods of rising inflation or emerging market growth (when commodity demand is high). Its financials (banks/insurers) benefit from higher interest rates. Meanwhile, consumer staples and healthcare in the UK provide stability and steady dividends. In short, the UK offers sector diversification that complements the U.S. tech dominance – an edge for building a balanced long-term portfolio. For example, the FTSE’s heavy mining exposure could shine in a “green metals” boom (as the world needs more copper, lithium, etc.), a scenario less relevant to the S&P. Having exposure to UK sectors can thus enhance resilience and capture opportunities that the U.S. market might miss.
Stability & Long-Term Wealth-Building Potential: The UK market is often seen as more of a “steady tortoise” to the U.S.’s “hare.” Its lower volatility and focus on fundamentals can be advantageous for patient long-term investors. Many UK blue-chips have been around for over a century, weathering wars and crises – this speaks to a certain stability. The combination of lower valuations and higher dividends means investors in UK stocks are less reliant on speculative growth and more on intrinsic value and income, which can lead to more stable, if modest, returns. In down markets, defensive UK sectors (utilities, staples, pharma) tend to decline less than high-beta tech stocks, helping preserve capital. Over time, continuously reinvesting those fat dividends and benefitting from earnings growth (even if slower) can compound reliably. There’s also a case that the UK market’s underperformance in the past decade has left many quality companies undervalued – so the downside risk is lower. Meanwhile, U.S. stocks, priced for perfection, could see lower future returns if starting valuations revert to normal. By diversifying into UK equities, investors add a margin of safety and reduce portfolio concentration in U.S. tech. History shows no market leads forever, and the UK’s time to outperform could come as cycles change. Finally, the UK’s regulatory and corporate governance environment tends to favour shareholder returns (through dividends and buybacks) and prudent management, which can aid long-term wealth building. In essence, the UK market offers a slower but steadier path to wealth, emphasizing value and income – an edge for those prioritizing capital preservation and consistent growth over flashy gains.
Valuations and Yields Summary
To highlight the differences, here’s a quick comparison of current valuation and income metrics between the UK and U.S. markets:
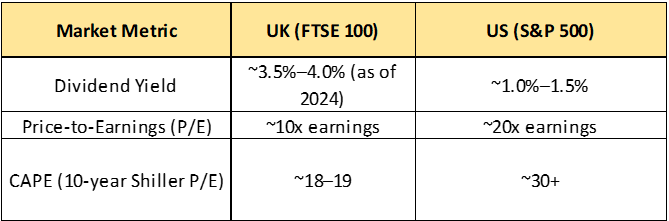
Table: UK equities trade at much lower valuation multiples than U.S. equities, and offer significantly higher dividend yields. This suggests the UK market may provide better value and income for long-term investors, whereas the U.S. commands a premium for its superior growth and tech dominance.
Conclusion
Both the S&P 500 and Scottish Mortgage Trust have been outstanding performers over the past 10–15 years, especially thanks to a prolonged bull market fueled by low interest rates. SMT’s ability to beat the S&P 500 in historical returns highlights the power of active stock selection in high-growth areas – but it also came with greater volatility. Macroeconomic currents (like falling/rising interest rates, low/high inflation, and currency shifts) played a significant role in shaping these outcomes. Looking ahead, investors should weigh the U.S. market’s growth leadership against the UK market’s value and income advantages. The UK offers appealing qualities for long-term investing – cheaper stocks, bigger dividends, and exposure to sectors that can complement U.S. tech. A balanced portfolio that includes both can harness the strengths of each: the innovation and dynamism of the U.S., and the stability and value of the UK. Diversifying internationally, one can benefit from cycles in different markets – for instance, if U.S. equities face a valuation-induced slowdown, UK equities might shine by virtue of their dividend yield and lower expectations. In sum, while the S&P 500 has been the star of recent decades, the UK market’s tortoise-like approach may well prove rewarding for patient investors focused on long-term wealth building.
*feel free to follow and subscribe to Finota.substack.com, we've got a detailed analysis on Scottish Mortgage Trust (SMT) coming up soon, along with regular updates on LSE-listed companies.